Uncertainty Likely to Fuel Interest Rate Trading in 2024

As we near the end of a tumultuous year for fixed income, uncertainty remains high particularly given the complex interplay between the Fed’s dual mandate of maximum employment and price stability. A few key factors to watch for the year ahead:
- The market is increasingly pricing in looser US monetary policy in 2024 as inflation appears to ease.
- Growing US debt issuance and ongoing quantitative tightening are impacting fiscal conditions.
- Recent economic indicators for the US economy have shifted from green to amber or even red.
- If US economic growth slows it will have a big impact on the Fed’s approach and US debt levels.
All of this suggests that a likely scenario for 2024 is a period of extended volatility in rates, with secondary effects in other asset classes as we saw this year.
The Federal Open Market Committee (FOMC) target rates are being held at 5.25% to 5.5%, with the Fed signalling at its December meeting that it is likely to cut rates next year. The Fed signaled three 2024 rate cuts and the CME Group FedWatch Tool median market rate probability for December 2024 moved to 3.75% to 4%. That target rate range was 0.5% higher throughout autumn and into November. The market shifted FOMC to a more aggressive cutting cycle and the range of potential outcomes is expanding; meaning some of the market is expecting even lower rates at the end of 2024.
Yields for Longer-Dated Debt Moving Rapidly
At the same time, longer-dated treasury rates also moved lower. In fact the 10-year BrokerTec Benchmark yield fell from 5% on October 19 to 4.1% on December 6. That brought the yield back below the prior high reached in December 2022.
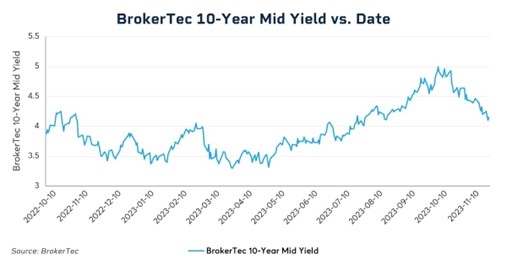
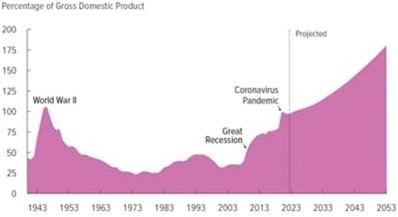
This tended to frustrate some market participants who noted that debt issuance is on track to grow significantly, the view being that increased issuance will command a higher risk premium in the yield, particularly with some big holders of Treasuries like Japan and China reducing their exposures. According to a report by the Congressional Budget Office, debt as a percentage of GDP has doubled over the prior decade, but it is expected to almost double again in the next 20 years.
Quantitative Tightening Impacts are Only Starting
The case for higher long-term yields seemed to be reinforced this year by what the market had termed quantitative tightening by the Federal Reserve.
From 2020 through mid 2022, in a period of quantitative easing, much of the Treasury issuance and a lot of Mortgage Back Securities (MBS) were purchased by the Federal Reserve Open Market Desk, significantly reducing the amount of duration issuance, by holding securities in its System Open Market Account (SOMA).
However in May 2022, the FOMC directed that the Federal Reserve reduce its purchases substantially, starting a period of quantitative tightening. Initially it capped the amount of purchases to principal and interest repayment in excess of $47.5 billion (£37.5bn) and further increased that cap in December 2022 to $95 billion. Thus, much of the duration of issuance only began to hit the market in 2023. Quantitative tightening has a lot further to run in 2024 and will significantly increase the amount of debt reaching the market.
System Open Market Account Treasuries Held
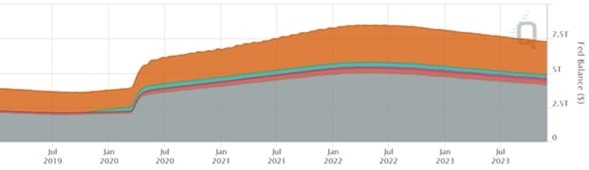
Source: CME Group TreasuryWatch Tool and FOMC
US Debt Issuance Focused on the Short End
More immediately, the US Treasury has been issuing more T-bills while only modestly increasing the size of coupon issuances. This is seen via the CME TreasuryWatch Tool. The considerable size of T-bill issuance of $400 to $600 billion a quarter helped to drive net borrowing by $350 billion in the third quarter of 2023. Net coupon issuance is expected to grow slightly, but remain around $300 billion per quarter. Currently, the US Treasury is favoring T-bill issuance over coupons. A big question for 2024 is whether that will continue to be the case.
Economic Data Continues to Drive Expectations
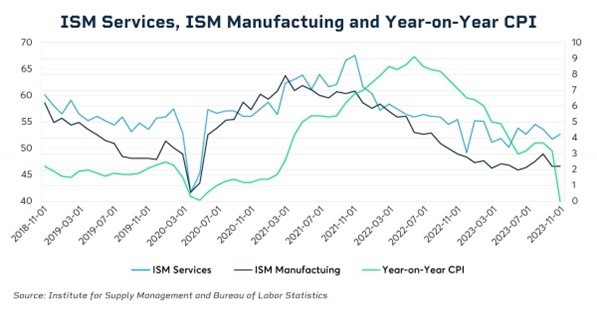
Higher frequency economic data seems to have a part in repricing market expectations. Consumer Price Inflation has come down from its highs. The Institute of Supply Management (ISM) Services index is now at a level that is lower than before the pandemic, while ISM Manufacturing has been below pre-pandemic levels throughout 2023 and recently turned back down. With a deeply inverted yield curve for most of 2023, the market is now looking closely at whether the US economy might be slowing in the face of the historically unprecedented rate rises of the last 12 months.
Uncertainty Drives Volatility Higher
The substantial volatility in rates we’ve seen in 2023 drove record levels of risk management at CME Group as participants hedged their positions with futures and options. Over the last two years, interest rate volatility has moved to a higher regime. That is seen in how the level of 10-Year CVOL has tripled from 50 basis points to 150 basis points.
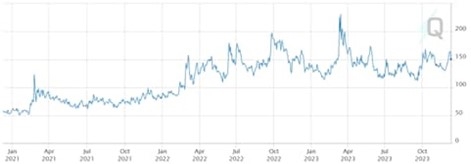
Source: CME Group
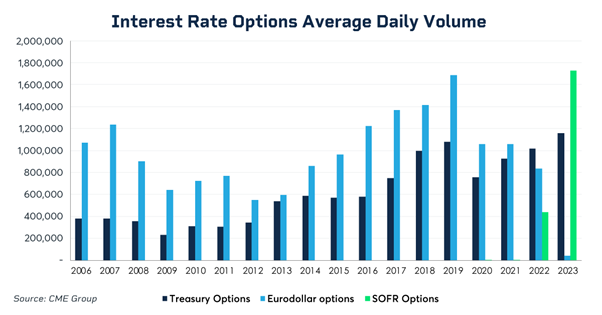
Markets have responded by risk managing this elevated level of volatility. Volumes for options on Treasury futures reached an all-time high and volume for options on Secured Overnight Financing Rate (SOFR) futures is now higher than volume on options on Eurodollar futures ever were.
As we shift through the cycle, the complex interplay of increasing debt issuance, quantitative tightening, and the Fed’s difficult balancing act on inflation and the economy mean that risk management is likely to be just as important in the year ahead.
Found this useful?
Take a complimentary trial of the FOW Marketing Intelligence Platform – the comprehensive source of news and analysis across the buy- and sell- side.
Gain access to:
- A single source of in-depth news, insight and analysis across Asset Management, Securities Finance, Custody, Fund Services and Derivatives
- Our interactive database, optimized to enable you to summarise data and build graphs outlining market activity
- Exclusive whitepapers, supplements and industry analysis curated and published by Futures & Options World
- Breaking news, daily and weekly alerts on the markets most relevant to you